


 SUBREGION II NORTH
Crop season 2012/13 was characterized by the marked effect of the 'El Niño' phenomenon developed with strong wind storms, hail and heavy rains with a pattern well above historical values. Overall yields were below normal and test weights were low. Although water availability did not limit crop yield expression, some diseases problems occurred.
Total rainfall from May to November 2012 was 958 mm, exceeding by almost three times historical values between 1951 and 2011, and the 2010-11 season too. The water contribution for the crop started from early tillering to stem elongation (August), and heavy rains continued throughout all the critical period and grain filling. Crop health was the determining factor for the yields.
Quality was highly affected by the low test weight, due to the presence of diseases, even in treated crops. Leaf diseases were widespread, and the presence of rust and fusarium head blight (Fusarium graminearum) was significant, since predisposing conditions were given at the heading-antesis period in most of the varieties.
There were cloudy days with low radiation, frosts and heat stroke at the beginning of November, resulting in small grains that did not complete their filling. Moreover those conditions contribute to the presence of grains with Fusarium in variable percentages, some of them particularly high. Fusarium often causes yield losses of nearly 20%, mainly related to sterile flowers and the formation of underdeveloped, wrinkled and low weight grains. Furthermore, not only affect the yield and quality, but also it may affect human and animal health by action of micotoxins such as deoxinivalenol (DON), linked to the fungus.
All those conditions resulted in crops yields significantly less than the expectations, according to their appearance. In the central region, wheat yields ranged between 1500 and 4000 kg/ha, between 1951 and 2011 between 1951 and 2011 reaching an average of 3,000 kg / ha.
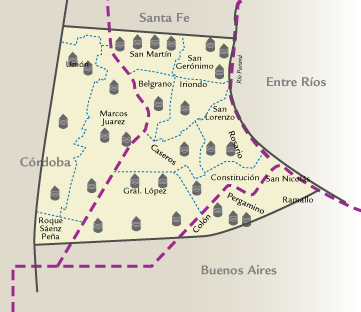
| MAP OF THE SUBREGION |
|
| |||||||||||||||||||||||||||||||||||||||||||||||||||||||||||||||||||||
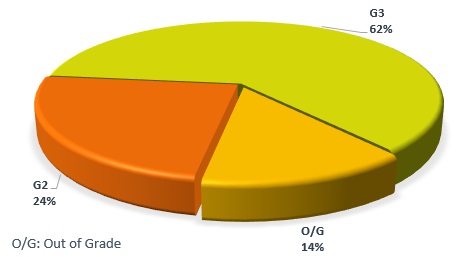
| GRADE DISTRIBUTION |
|
| FLOUR ANALYSIS | PARAMETERS | MINIMUM | MAXIMUM | AVERAGE | STANDARD DEVIATION | VARIATION COEFFICIENT | |||
| MILLING | Wet Gluten (% | 26,9 | 32,8 | 29,2 | 1,4 | 4,66 | |||
| Dry Gluten (%) | 9,3 | 11,1 | 9,9 | 0,4 | 4,32 | ||||
| Falling Number (seg.) | 430 | 505 | 465 | 18 | 3,96 | ||||
| Flour Yield (%) | 68,1 | 74,8 | 72,0 | 1,7 | 2,37 | ||||
| Ash (dry basis) (%) | 0,645 | 0,865 | 0,749 | 0,059 | 7,87 | ||||
| FARINOGRAM | Water Absorption (14% H°) (%) | 55,3 | 59,0 | 57,2 | 1,0 | 1,71 | |||
| Development Time (min.) | 4,6 | 8,2 | 6,4 | 0,9 | 13,78 | ||||
| Stability (min.) | 5,9 | 14,8 | 10,2 | 2,4 | 23,24 | ||||
| Degree of Softening (12 min.) | 43 | 98 | 66 | 15 | 23,09 | ||||
| P (mm) | 50 | 88 | 68 | 9 | 12,73 | ||||
| ALVEOGRAM | |||||||||
| L (mm) | 91 | 129 | 105 | 9 | 8,76 | ||||
| W Joules x 10-4 | 146 | 285 | 220 | 32 | 14,71 | ||||
| P / L | 0,40 | 0,90 | 0,65 | 0,12 | 17,77 | ||||
| These results were elaborated with 29 composite samples prepared proportionally from 360 primary samples (farmer deliveries) | |||||||||
SUBREGION DATA
In this sub region the wheat production was 1.206.312 tons., the 14,5 % of the national total. Were sampled 116,000 tons., the 9.62% of the sub region production.
| APPENDIX OF LOCALITY COMPOSITE SAMPLES | |||||||||||||
| SAMPLE IDENTIFICATION | WHEAT ANALYSIS | ||||||||||||
| SAMPLE NUMBER | LOCALITY, DISTRICT OR DEPARTMENT | TONNAJE | GRADE | TEST WEIGT (Kg/hl) | TOTAL DAMAGED KERNELS(%) | FOREIGN MATERIAL (%) |
SHRUNKEN AND BROKEN KERNELS
(%) | YELLOW BERRY KERNELS (%) |
PROTEIN (MOISTURE 13,5 % H°) |
PROTEIN (s/S.S.S.) | WEIGT OF 1000 KERNELS | ASH(dry basis) % | |
| 101 | San Martín | 4000 | 3 | 75,10 | 2,00 | 0,10 | 0,80 | 0,30 | 12,5 | 14,5 | 28,60 | 2,055 | |
| 102 | San Martín | 4000 | 3 | 73,80 | 2,20 | 0,90 | 0,90 | 0,30 | 12,0 | 13,9 | 28,60 | 1,935 | |
| 103 | San Martín | 4000 | F/E | 70,50 | 2,70 | 0,40 | 1,10 | 0,20 | 11,9 | 13,8 | 17,60 | 2,055 | |
| 104 | San Martín | 4000 | 2 | 76,20 | 1,10 | 0,10 | 0,90 | 0,20 | 11,7 | 13,5 | 29,90 | 1,865 | |
| 105 | San Jerónimo | 4000 | F/E | 72,10 | 2,40 | 1,80 | 1,10 | 0,20 | 11,7 | 13,8 | 27,30 | 1,945 | |
| 106 | San Jerónimo | 4000 | 3 | 74,80 | 1,20 | 0,40 | 1,20 | 0,00 | 11,9 | 13,8 | 27,70 | 2,005 | |
| 107 | San Jerónimo | 4000 | 3 | 74,80 | 2,90 | 0,50 | 1,20 | 0,30 | 11,9 | 13,4 | 28,50 | 2,045 | |
| 108 | Caseros | 4000 | 3 | 75,50 | 1,80 | 0,20 | 0,50 | 0,00 | 11,6 | 13,3 | 28,50 | 1,915 | |
| 109 | Belgrano | 4000 | 3 | 74,00 | 1,60 | 0,20 | 0,90 | 0,20 | 11,5 | 14,1 | 27,60 | 1,965 | |
| 110 | Iriondo | 4000 | 3 | 74,30 | 0,20 | 0,70 | 0,10 | 12,2 | 14,0 | 28,20 | 28,42 | 1,995 | |
| 111 |
| 4000 | 3 | 75,20 | 1,90 | 0,80 | 1,00 | 0,60 | 12,1 | 13,4 | 27,70 | 1,985 | |
| 112 |
| 4000 | 3 | 74,50 | 2,00 | 0,30 | 1,50 | 0,00 | 11,6 | 13,5 | 27,30 | 1,985 | |
| 113 |
| 4000 | F/E | 72,10 | 1,60 | 0,50 | 1,50 | 0,40 | 11,7 | 13,6 | 24,60 | 1,745 | |
| 114 |
| 4000 | F/E | 71,00 | 1,90 | 0,70 | 0,80 | 0,20 | 11,8 | 13,4 | 26,30 | 1,985 | |
| 115 |
| 4000 | 3 | 74,40 | 1,40 | 0,40 | 1,00 | 0,00 | 11,6 | 13,5 | 28,50 | 1,945 | |
| 116 |
| 4000 | 3 | 75,60 | 1,20 | 0,20 | 0,08 | 0,00 | 11,7 | 13,8 | 31,30 | 1,905 | |
| 117 |
| 4000 | 3 | 75,50 | 1,30 | 1,60 | 0,60 | 0,00 | 11,7 | 14,7 | 20,34 | 1,875 | |
| 118 |
| 4000 | 3 | 75,20 | 2,30 | 1,60 | 1,20 | 0,20 | 11,9 | 13,5 | 29,30 | 1,915 | |
| 119 |
| 4000 | 3 | 74,40 | 1,90 | 0,40 | 1,10 | 0,00 | 12,7 | 14,3 | 30,50 | 1,965 | |
| 120 |
| 4000 | 2 | 77,10 | 1,30 | 0,30 | 0,70 | 0,80 | 11,7 | 14,6 | 30,60 | 1,945 | |
| 121 |
| 4000 | 2 | 76.30 | 1,60 | 0,60 | 0,80 | 0,30 | 12,4 | 14,1 | 29,60 | 2,045 | |
| 122 |
| 4000 | 2 | 76.00 | 2,00 | 0,30 | 0,70 | 0,40 | 12,6 | 13,6 | 28,50 | 1,885 | |
| 123 |
| 4000 | 2 | 76.00 | 1,70 | 0,50 | 0,70 | 0,20 | 12,2 | 14,1 | 31,00 | 1,925 | |
| 124 |
| 4000 | 2 | 76.20 | 1,10 | 0,30 | 0,80 | 0,10 | 11,8 | 14,3 | 30,60 | 1,945 | |
| 125 |
| 4000 | 3 | 75,10 | 1,80 | 0,30 | 1,20 | 0,20 | 12,2 | 13,5 | 28,40 | 1,925 | |
| 126 |
| 4000 | 3 | 73,60 | 1,30 | 0,50 | 0,80 | 0,30 | 12,4 | 13,6 | 28,80 | 2,065 | |
| 127 |
| 4000 | 3 | 77,20 | 2,30 | 0,40 | 0,60 | 0,50 | 11,7 | 13,8 | 30,10 | 1,905 | |
| 128 |
| 4000 | 2 | 76.60 | 1,70 | 0,30 | 0,90 | 0,50 | 11,8 | 13,4 | 30,10 | 1,955 | |
| 129 |
| 4000 | 3 | 75,60 | 1,90 | 0,40 | 1,00 | 0,60 | 11,9 | 13,5 | 30,50 | 1,955 | |
| APPENDIX OF LOCALITY COMPOSITE SAMPLES | |||||||||||||||
| SAMPLE IDENTIFICATION | WHEAT ANALYSIS | ||||||||||||||
| SAMPLE NUMBER | LOCALITY, DISTRICT OR DEPARTMENT | WET GLUTEN(%) | DRY GLUTEN(%) | FALLING NUMBER (SEG.) | FLOUR YIELD(%) | FARINOGRAM | ALVEOGRAM | ASH(dry basis)(%) | |||||||
| % AA (14 % H°) | T, D, (MIN.) | STABILITY (MIN.) | DEGREE SOFTENING(12 MIN.) | P | L | W | P/ | ||||||||
| 101 | San Martín | 31,7 | 10,5 | 474 | 70,5 | 57,5 | 6,0 | 9,4 | 60 | 69 | 96 | 214 | 0,72 | 0,715 | |
| 102 | San Martín | 31,2 | 10,3 | 464 | 71,0 | 57,7 | 6,1 | 9,4 | 60 | 71 | 104 | 229 | 0,68 | 0,665 | |
| 103 | San Martín | 28,2 | 9,5 | 493 | 73,2 | 56,9 | 5,8 | 8,8 | 81 | 60 | 99 | 182 | 0,61 | 0,795 | |
| 104 | San Martín | 27,5 | 9,5 | 450 | 69,9 | 56,8 | 7,8 | 13,3 | 47 | 73 | 98 | 240 | 0,74 | 0,715 | |
| 105 | San Jerónimo | 29,8 | 9,5 | 450 | 71,1 | 57,0 | 4,6 | 5,9 | 98 | 50 | 108 | 204 | 0,57 | 0,715 | |
| 106 | San Jerónimo | 28,7 | 9,6 | 468 | 70,6 | 56,8 | 5,4 | 7,5 | 89 | 58 | 99 | 174 | 0,59 | 0,795 | |
| 107 | San Jerónimo | 28,7 | 9,6 | 468 | 70,6 | 56,8 | 5,4 | 7,5 | 89 | 58 | 99 | 174 | 0,59 | 0,795 | |
| 108 | Caseros | 28,0 | 9,6 | 483 | 72,5 | 57,7 | 5,8 | 9,1 | 68 | 64 | 105 | 210 | 0,61 | 0,655 | |
| 109 | Belgrano | 28,3 | 9,5 | 505 | 68,8 | 56,0 | 5,4 | 8,3 | 73 | 57 | 108 | 177 | 0,53 | 0,725 | |
| 110 | Iriondo | 29,7 | 9,9 | 499 | 72,3 | 58,1 | 5,2 | 6,8 | 81 | 60 | 125 | 203 | 0,48 | 0,645 | |
| 111 |
| 29,3 | 10,3 | 485 | 71,3 | 57,6 | 6,8 | 10,5 | 59 | 70 | 111 | 237 | 0,63 | 0,805 | |
| 112 |
| 27,6 | 9,4 | 441 | 70,2 | 55,5 | 6,7 | 10,6 | 55 | 65 | 104 | 209 | 0,63 | 0,685 | |
| 113 |
| 26,9 | 9,3 | 460 | 73,5 | 55,7 | 5,4 | 8,0 | 94 | 51 | 126 | 167 | 0,40 | 0,745 | |
| 114 |
| 27,7 | 9,6 | 444 | 71,8 | 56,1 | 6,9 | 12,5 | 53 | 69 | 98 | 217 | 0,70 | 0,655 | |
| 115 |
| 28,7 | 9,6 | 464 | 73,5 | 56,3 | 7,2 | 12,8 | 57 | 72 | 96 | 228 | 0,75 | 0,755 | |
| 116 |
| 26,1 | 9,9 | 482 | 73,9 | 57,9 | 7,2 | 11,7 | 54 | 80 | 106 | 266 | 0,75 | 0,865 | |
| 117 |
| 29,6 | 9,9 | 448 | 74,8 | 56,1 | 6,4 | 10,1 | 64 | 69 | 103 | 213 | 0,67 | 0,835 | |
| 118 |
| 29,0 | 9,8 | 464 | 74,0 | 59,0 | 6.3 | 9,7 | 66 | 82 | 91 | 240 | 0,90 | 0,745 | |
| 119 |
| 32,8 | 11,1 | 481 | 68,1 | 58,7 | 5,3 | 6,9 | 84 | 66 | 129 | 221 | 0,51 | 0,725 | |
| 120 |
| 28,3 | 9,8 | 459 | 73,1 | 58,1 | 8,2 | 14,2 | 50 | 88 | 100 | 285 | 0,88 | 0,755 | |
| 121 |
| 29,6 | 10,1 | 430 | 71,7 | 57,3 | 7,8 | 13,1 | 45 | 76 | 104 | 258 | 0,73 | 0,715 | |
| 122 |
| 29,7 | 10,2 | 458 | 74,7 | 56,9 | 6,3 | 10,3 | 65 | 68 | 99 | 210 | 0,69 | 0,845 | |
| 123 |
| 30,6 | 10,2 | 474 | 72,7 | 57,6 | 6,7 | 12,4 | 55 | 79 | 99 | 264 | 0,80 | 0,775 | |
| 124 |
| 31,1 | 10,7 | 470 | 72,9 | 57,1 | 7,5 | 12,4 | 54 | 77 | 95 | 244 | 0,81 | 0,775 | |
| 125 |
| 27,3 | 9,4 | 453 | 73,0 | 55,3 | 7,2 | 14,8 | 43 | 72 | 108 | 251 | 0,67 | 0,705 | |
| 126 |
| 30,1 | 10,2 | 480 | 69,6 | 56,6 | 6,9 | 12,7 | 52 | 68 | 113 | 239 | 0,60 | 0,805 | |
| 127 |
| 29,2 | 9,9 | 439 | 73,2 | 58,5 | 6,0 | 7,8 | 81 | 71 | 93 | 197 | 0,76 | 0,815 | |
| 128 |
| 30,1 | 10,4 | 468 | 73,0 | 57,1 | 6,3 | 9,5 | 68 | 61 | 103 | 197 | 0,59 | 0,765 | |
| 129 |
| 29,1 | 9,8 | 451 | 73,0 | 58,6 | 6,7 | 11,4 | 57 | 74 | 108 | 263 | 0,69 | 0,705 | |