


 SUBREGION II NORTH
Water availability was a limiting factor in the expression of the wheat crop yield. At the beginning of June, the initial water supply in the soil profile was 197 mm, which represented approximately a 65 % of the maximum level of available soil water up to two meters deep. At tillering and stem elongation the water supply was of only 24 mm and 30 mm at heading, occurred by the end of September and mid-October. During grain filling, from mid-October to mid-November, more abundant rains (270 mm) occurred -77 % of the accumulated rains.
Maximum average temperatures surpassed in 2 ºC the historical, with significant differences in early September (+8 ºC) and during October (+4.5 ºC). Regarding the minimum temperatures, were in average similar to the historical ones, with two specific increases, in the first decade of September (+ 4.4 ºC) and in the second decade of October (+ 3.4 ºC).
During grain filling, approximately since mid-October to mid-November, the maximum and minimum temperatures were relatively high favoring a proper grain growth rate.
With respect to leaf diseases, there was only presence of orange rust and yellow spot, with an average of severity percentage lower than 5 %, considered as low. There was no presence of Fusarium head blight.
Yields of wheat crops were variable, from 600 kg/ha in drier areas and with problems due to late frosts, where some plots were not harvested, until 5500 to 6000 kg/ha in lots of areas with better soils, with timely rains or with the contribution of aquifers. The average yield in the sampled area was close to 2700 kg/ha.
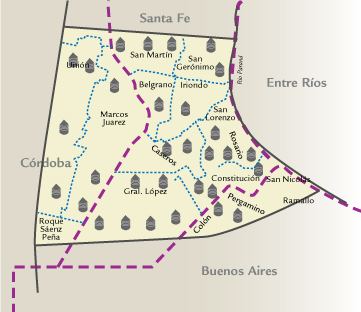
| MAP OF THE SUBREGION |
|
| |||||||||||||||||||||||||||||||||||||||||||||||||||||||||||||||||||||
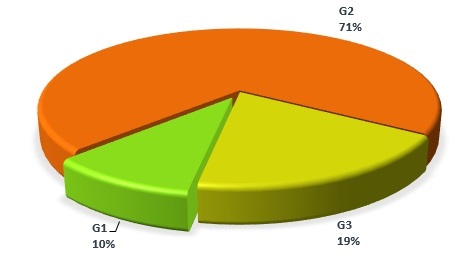
| GRADE DISTRIBUTION |
|
| FLOUR ANALYSIS | PARAMETERS | MINIMUM | MAXIMUM | AVERAGE | STANDARD DEVIATION | VARIATION COEFFICIENT | |||
| MILLING | Wet Gluten (%) | 19,2 | 34,8 | 28,6 | 2,8 | 0,10 | |||
| Dry Gluten (%) | 6,6 | 12,0 | 9,8 | 0,9 | 0,10 | ||||
| Falling Number (seg.) | 184 | 452 | 393 | 48 | 0,12 | ||||
| Flour Yield (%) | 68,1 | 74,4 | 71,3 | 1,7 | 0,02 | ||||
| Ash (dry basis)(%) | 0,525 | 0,755 | 0,644 | 0,054 | 0,08 | ||||
| FARINOGRAM | Water Absorption(14 % H°) (%) | 56,0 | 60,1 | 58,1 | 0,9 | 0,02 | |||
| Development Time (min.) | 1,4 | 13,4 | 7,3 | 3,7 | 0,50 | ||||
| Stability (min.) | 1,5 | 24,3 | 14,6 | 7,7 | 0,53 | ||||
| Degree of Softening (12 min.) | 17 | 109 | 41 | 24 | 0,58 | ||||
| P (mm) | 76 | 116 | 91 | 9 | 0,10 | ||||
| ALVEOGRAM | |||||||||
| L (mm) | 41 | 132 | 93 | 18 | 0,20 | ||||
| W Joules x 10-4 | 194 | 347 | 285 | 31 | 0,11 | ||||
| P / L | 0,61 | 2,66 | 0,98 | 0,38 | 0,36 | ||||
| These results were elaborated with 31 composite samples prepared proportionally from 426 primary samples (farmer deliveries). | |||||||||
SUBREGION DATA
In this sub region the wheat production was 1.075.095 tons., the 11,8 % of the national total. Were sampled 124.000 tons., the 11,53 % of the sub region production.
| APPENDIX OF LOCALITY COMPOSITE SAMPLES | |||||||||||||
| SAMPLE IDENTIFICATION | WHEAT ANALYSIS | ||||||||||||
| SAMPLE NUMBER | LOCALITY, DISTRICT OR DEPARTMENT | TONNAJE | GRADE | TEST WEIGT (Kg/hl) | TOTAL DAMAGED KERNELS(%) | FOREIGN MATERIAL (%) |
SHRUNKEN AND BROKEN KERNELS (%) | YELLOW BERRY KERNELS (%) |
PROTEIN (MOISTURE 13,5 % H°) |
PROTEIN (s/S.S.S.) | WEIGT OF 1000 KERNELS | ASH(dry basis) % | |
| 101 | San Martín | 4000 | 2 | 77,50 | 0,90 | 0,10 | 0,90 | 0,00 | 13,7 | 0 | 27,40 | 1,975 | |
| 102 | San Martín | 4000 | 2 | 78,40 | 0,20 | 0,10 | 0,80 | 0,30 | 12,8 | 0 | 31,30 | 1,935 | |
| 103 | San Martín | 4000 | 2 | 78,60 | 0,60 | 0,20 | 0,60 | 0,40 | 13,0 | 0 | 29,40 | 2,015 | |
| 104 | San Jerónimo | 4000 | 3 | 80,40 | 0,90 | 0,20 | 0,60 | 0,40 | 12,0 | 0 | 32,10 | 1,955 | |
| 105 | San Jerónimo | 4000 | 2 | 79,10 | 1,50 | 0,20 | 0,70 | 0,50 | 12,6 | 0 | 30,00 | 1,915 | |
| 106 | Caseros | 4000 | 3 | 77,20 | 0,50 | 0,70 | 1,60 | 2,00 | 11,6 | 0 | 29,10 | 1,875 | |
| 107 | Caseros | 4000 | 2 | 78,30 | 0,30 | 0,30 | 0,80 | 1,50 | 11,7 | 0 | 31,70 | 1,875 | |
| 108 | Belgrano | 4000 | 1 | 79,40 | 0,50 | 0,20 | 0,40 | 2,30 | 11,5 | 0 | 31,50 | 1,865 | |
| 109 | Iriondo | 4000 | 2 | 79,00 | 1,30 | 0,20 | 0,60 | 1,00 | 11,8 | 0 | 30,00 | 1,755 | |
| 110 | San Lorenzo | 4000 | 2 | 78,60 | 0,60 | 0,10 | 0,90 | 0,50 | 11,7 | 0 | 30,40 | 1,815 | |
| 111 |
| 4000 | 2 | 77,90 | 0,60 | 0,20 | 0,80 | 0,60 | 12,1 | 0 | 28,50 | 1,795 | |
| 112 |
| 4000 | 2 | 79,40 | 0,50 | 0,30 | 0,90 | 0,20 | 12,6 | 0 | 29,10 | 1,665 | |
| 113 |
| 4000 | 2 | 78,21 | 0,40 | 0,20 | 0,30 | 0,40 | 12,1 | 0 | 29,20 | 1,935 | |
| 114 |
| 4000 | 2 | 79,50 | 1,10 | 1,00 | 0,00 | 1,00 | 12,2 | 0 | 31,50 | 1,725 | |
| 115 |
| 4000 | 3 | 78,70 | 1,00 | 2,00 | 0,60 | 0,10 | 12,2 | 0 | 32,60 | 1,705 | |
| 116 |
| 4000 | 3 | 79,00 | 1,20 | 0,20 | 0,40 | 0,40 | 11,7 | 0 | 32,30 | 1,745 | |
| 117 |
| 4000 | 1 | 79,60 | 0,80 | 0,10 | 0,40 | 1,60 | 11,2 | 0 | 33,70 | 1,755 | |
| 118 |
| 4000 | 2 | 78,70 | 1,00 | 0,10 | 0,40 | 0,50 | 11,0 | 0 | 33,20 | 1,655 | |
| 119 |
| 4000 | 1 | 79,10 | 0,80 | 0,20 | 0,40 | 0,50 | 11,2 | 0 | 35,50 | 1,695 | |
| 120 |
| 4000 | 2 | 77,90 | 0,60 | 0,30 | 0,70 | 1,20 | 11,7 | 0 | 32,30 | 1,835 | |
| 121 |
| 4000 | 2 | 77,00 | 0,30 | 0,30 | 0,70 | 0,20 | 12,3 | 0 | 31,70 | 1,745 | |
| 122 |
| 4000 | 2 | 78,70 | 1,30 | 0,20 | 0,60 | 1,80 | 11,4 | 0 | 33,70 | 1,745 | |
| 123 |
| 4000 | 2 | 77,60 | 1,10 | 0,10 | 0,50 | 0,10 | 12,7 | 0 | 29,90 | 2,025 | |
| 124 |
| 4000 | 2 | 77,60 | 1,10 | 0,40 | 1,00 | 0,20 | 12,4 | 0 | 30,00 | 2,085 | |
| 125 |
| 4000 | 2 | 77,10 | 1,70 | 0,20 | 0,50 | 0,00 | 12,5 | 0 | 30,30 | 2,015 | |
| 126 |
| 4000 | 2 | 76,70 | 1,40 | 0,50 | 0,30 | 0,00 | 12,5 | 0 | 29,70 | 1,935 | |
| 127 |
| 4000 | 3 | 78,20 | 2,50 | 0,20 | 0,60 | 0,00 | 12,3 | 0 | 30,20 | 1,915 | |
| 128 |
| 4000 | 2 | 78,80 | 1,60 | 0,70 | 0,30 | 0,10 | 12,6 | 0 | 30,60 | 1,985 | |
| 129 |
| 4000 | 3 | 78,50 | 2,30 | 0,20 | 0,70 | 0,20 | 12,0 | 0 | 31,50 | 1,955 | |
| 130 |
| 4000 | 2 | 78,60 | 1,10 | 0,20 | 0,60 | 0,20 | 12,0 | 0 | 34,80 | 1,855 | |
| 131 |
| 4000 | 2 | 78,30 | 0,50 | 0,40 | 0,20 | 1,30 | 12,9 | 0 | 33,50 | 1,795 | |
| APPENDIX OF LOCALITY COMPOSITE SAMPLES | |||||||||||||||
| SAMPLE IDENTIFICATION | WHEAT ANALYSIS | ||||||||||||||
| SAMPLE NUMBER | LOCALITY, DISTRICT OR DEPARTMENT | WET GLUTEN(%) | DRY GLUTEN(%) | FALLING NUMBER (SEG.) | FLOUR YIELD(%) | FARINOGRAM | ALVEOGRAM | ASH(dry basis)(%) | |||||||
| % AA (14 % H°) | T, D, (MIN.) | STABILITY (MIN.) | DEGREE SOFTENING(12 MIN.) | P | L | W | P/L | ||||||||
| 101 | San Martín | 34,8 | 12,0 | 438 | 69,6 | 59,4 | 10,3 | 17,7 | 31 | 90 | 109 | 323 | 0,83 | 0,685 | |
| 102 | San Martín | 31,7 | 10,9 | 433 | 70,6 | 57,9 | 8,2 | 17,0 | 28 | 86 | 114 | 323 | 0,75 | 0,615 | |
| 103 | San Martín | 27,7 | 9,6 | 338 | 68,9 | 58,8 | 7,1 | 14,8 | 35 | 91 | 90 | 277 | 1,01 | 0,615 | |
| 104 | San Jerónimo | 30,6 | 10,5 | 373 | 68,1 | 58,6 | 4,6 | 18,0 | 24 | 95 | 92 | 300 | 1,03 | 0,645 | |
| 105 | San Jerónimo | 32,5 | 11,1 | 389 | 69,8 | 58,8 | 9,2 | 17,0 | 32 | 88 | 108 | 319 | 0,81 | 0,635 | |
| 106 | Caseros | 26,5 | 9,4 | 393 | 69,7 | 56,0 | 10,0 | 18,5 | 30 | 76 | 102 | 262 | 0,75 | 0,575 | |
| 107 | Caseros | 27,4 | 9,4 | 416 | 71,0 | 57,2 | 10,1 | 19,2 | 25 | 88 | 89 | 265 | 0,99 | 0,625 | |
| 108 | Caseros | 27,0 | 9,3 | 368 | 69,4 | 57,3 | 8,7 | 16,7 | 35 | 87 | 89 | 261 | 0,98 | 0,655 | |
| 109 | Iriondo | 27,5 | 9,4 | 404 | 69,5 | 58,2 | 12,0 | 20,8 | 23 | 102 | 78 | 288 | 1,31 | 0,645 | |
| 110 | San Lorenzo | 28,0 | 9,5 | 387 | 70,1 | 57,7 | 11,6 | 22,5 | 22 | 96 | 83 | 285 | 1,16 | 0,715 | |
| 111 |
| 28,5 | 9,8 | 429 | 70,2 | 57,4 | 13,4 | 24,3 | 18 | 90 | 95 | 294 | 0,95 | 0,685 | |
| 112 |
| 29,9 | 10,3 | 435 | 70,9 | 57,2 | 12,2 | 23,8 | 19 | 84 | 118 | 330 | 0,71 | 0,645 | |
| 113 |
| 29,7 | 9,9 | 492 | 74,0 | 56,9 | 10,8 | 21,5 | 24 | 81 | 132 | 347 | 0,61 | 0,615 | |
| 114 |
| 30,5 | 10,3 | 407 | 72,2 | 57,5 | 10,0 | 21,0 | 25 | 87 | 102 | 301 | 0,85 | 0,595 | |
| 115 |
| 28,4 | 9,6 | 184 | 73,1 | 58,9 | 2,2 | 3,2 | 87 | 82 | 96 | 278 | 0,85 | 0,595 | |
| 116 |
| 27,4 | 9,5 | 384 | 70,4 | 56,6 | 11,3 | 23,4 | 17 | 85 | 109 | 311 | 0,78 | 0,605 | |
| 117 |
| 26,3 | 8,9 | 370 | 73,6 | 59,1 | 1,7 | 1,7 | 74 | 90 | 75 | 248 | 1,20 | 0,625 | |
| 118 |
| 24,0 | 8,3 | 387 | 73,0 | 57,6 | 2,2 | 2,1 | 70 | 89 | 68 | 229 | 1,31 | 0,575 | |
| 119 |
| 26,0 | 8,8 | 367 | 73,5 | 59,2 | 2,0 | 2,2 | 69 | 106 | 68 | 268 | 1,56 | 0,645 | |
| 120 |
| 28,0 | 9,9 | 403 | 72,8 | 59,0 | 2,1 | 2,7 | 63 | 96 | 83 | 282 | 1,16 | 0,675 | |
| 121 |
| 28,3 | 9,9 | 431 | 73,6 | 57,8 | 1,8 | 2,4 | 72 | 94 | 85 | 276 | 1,11 | 0,645 | |
| 122 |
| 25,6 | 8,8 | 369 | 72,5 | 59,0 | 2,2 | 2,0 | 78 | 97 | 71 | 252 | 1,37 | 0,545 | |
| 123 |
| 30,1 | 10,3 | 422 | 71,4 | 59,1 | 6,7 | 16,8 | 32 | 96 | 91 | 300 | 1,05 | 0,675 | |
| 124 |
| 31,7 | 10,9 | 410 | 71,3 | 57,4 | 8,9 | 18,9 | 30 | 88 | 95 | 276 | 0,93 | 0,665 | |
| 125 |
| 30,1 | 10,3 | 393 | 71,4 | 58,7 | 6,8 | 12,9 | 44 | 77 | 117 | 273 | 0,66 | 0,755 | |
| 126 |
| 30,4 | 10,4 | 339 | 70,4 | 58,2 | 6,5 | 13,8 | 40 | 91 | 98 | 297 | 0,93 | 0,735 | |
| 127 |
| 30,3 | 10,2 | 396 | 69,4 | 57,7 | 7,8 | 19,2 | 26 | 90 | 97 | 287 | 0,93 | 0,675 | |
| 128 |
| 30,9 | 10,6 | 394 | 70,1 | 57,3 | 7,7 | 19,5 | 29 | 82 | 116 | 307 | 0,71 | 0,675 | |
| 129 |
| 28,6 | 9,7 | 394 | 72,5 | 57,4 | 6,9 | 18,1 | 28 | 86 | 96 | 271 | 0,90 | 0,755 | |
| 130 |
| 28,6 | 9,6 | 442 | 72,8 | 60,1 | 10,2 | 19,2 | 26 | 116 | 76 | 326 | 1,53 | 0,525 | |
| 131 |
| 19,2 | 6,6 | 433 | 74,4 | 58,2 | 1,4 | 1,5 | 109 | 109 | 41 | 194 | 2,66 | 0,655 | |