 SUBREGION I
It was a wet end of the 2017 wheat crop season, with moderate temperatures..
Only three frosts were recorded in June and July. Frost damaged the crop that was still booting.
Rainfall in August and September was 115 mm, very favorable for bacterial and fungal diseases, especially, stem fusarium (Fusarium graminearum.) Yield loss due to stem fusarium is estimated to be over 40%. Crop looked good until flowering. Fusarium was present in all varieties; however, the proportion of stems affected was different.
Some blight, bacterial infection and yellow spot symptoms were observed before flowering (Drechslera tritici repentis). At grain filling, leaf rust (Puccinia triticina) and stem rust (Puccinia graminis) affected the crop.
Grain protein content was between 9 and 12%. Test weight was low or very low, and the number of grains per square meter was between 21 and 35g.
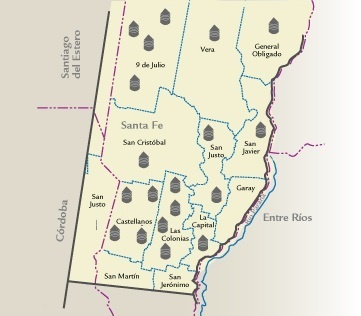
| | MAP OF THE SUBREGION |
 |
| |||||||||||||||||||||||||||||||||||||||||||||||||||||||||||||||||||||||
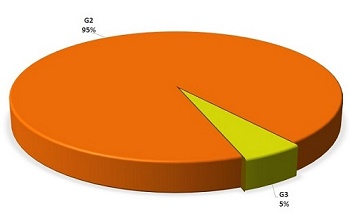
| | GRADE DISTRIBUTION |

|
| FLOUR ANALYSIS |
PARAMETERS | MINIMUM | MAXIMUM | AVERAGE | STANDARD DEVIATION | VARIATION COEFFICIENT | |||
| MILLING | Wet Gluten (%) | 23,9 | 28,4 | 26,0 | 1,3 | 4,89 | |||
| Dry Gluten (%) | 8,1 | 9,6 | 8,8 | 0,5 | 5,32 | ||||
| Falling Number (s) | 339 | 426 | 401 | 24 | 6,00 | ||||
| Flour Yield (%) | 47,80 | 71,22 | 66,74 | 6,60 | 9,88 | ||||
| Ash (dry basis) (%) | 0,495 | 0,715 | 0,619 | 0,053 | 8,62 | ||||
| FARINOGRAM | Water Absorption (14%H°)(%) | 54,7 | 61,3 | 57,5 | 1,8 | 3,19 | |||
| Development Time (min.) | 1,7 | 10,3 | 4,3 | 2,9 | 67,29 | ||||
| Stability (min.) | 2,5 | 18,0 | 9,8 | 4,3 | 43,66 | ||||
| Degree of Softening (12 min.) | 38 | 78 | 53 | 11 | 21,51 | ||||
| ALVEOGRAM | |||||||||
| P (mm) | 60 | 90 | 71 | 10 | 13,46 | ||||
| L (mm) | 79 | 128 | 104 | 12 | 11,61 | ||||
| W Joules x 10-4 | 198 | 282 | 236 | 23 | 9,83 | ||||
| P / L | 0,47 | 1,13 | 0,68 | 0,18 | 26,23 | ||||
| These results were elaborated with 19 composite samples prepared proportionally from 451 primary samples (farmer deliveries) | |||||||||
SUBREGION DATA
In this sub region the wheat production was 1.840.229 tons., the 10,0 % of the national total. Were sampled 67.430 tons., the 3,7% of the sub region production.| APPENDIX OF LOCALITY COMPOSITE SAMPLES | |||||||||||||
| SAMPLE IDENTIFICATION | WHEAT ANALYSIS | ||||||||||||
| SAMPLE NUMBER | LOCALITY, DISTRICT OR DEPARTMENT | TONNAJE | GRADE | TEST WEIGT (Kg/hl) |
TOTAL DAMAGED KERNELS (%) | FOREIGN MATERIAL (%) |
SHRUNKEN AND BROKEN KERNELS (%) | YELLOW BERRY KERNELS (%) |
PROTEIN (MOISTURE 13,5 % H°) (%) |
PROTEIN (dry basis) (%) |
WEIGT OF 1000 KERNELS (g) |
ASH (dry basis) (%) | |
| 1 | General Obligado | 5410 | 2 | 80,40 | 1,16 | 0,20 | 0,54 | 14,20 | 10,9 | 12,6 | 29,96 | 1,817 | |
| 2 | 9 de Julio | 3180 | 2 | 80,80 | 1,18 | 0,26 | 0,84 | 8,40 | 11,2 | 12,9 | 28,36 | 1,872 | |
| 3 | 9 de Julio | 3620 | 2 | 79,30 | 1,70 | 0,20 | 0,30 | 6,30 | 10,9 | 12,6 | 31,48 | 1,941 | |
| 4 | 9 de Julio | 3880 | 2 | 79,10 | 0,68 | 0,30 | 0,50 | 6,00 | 11,3 | 13,1 | 29,66 | 1,688 | |
| 5 | 9 de Julio | 3170 | 2 | 81,80 | 0,18 | 0,26 | 0,28 | 8,20 | 10,4 | 12,0 | 33,86 | 1,774 | |
| 6 | San Javier | 1820 | 2 | 79,00 | 1,00 | 0,24 | 0,56 | 8,50 | 10,8 | 12,5 | 31,64 | 1,754 | |
| 7 | Vera | 2270 | 2 | 80,30 | 0,38 | 0,24 | 0,94 | 0,00 | 11,3 | 13,1 | 28,32 | 2,027 | |
| 8 | Castellanos | 4270 | 3 | 79,30 | 1,22 | 1,20 | 0,62 | 12,20 | 9,9 | 11,4 | 32,60 | 2,002 | |
| 9 | Castellanos | 3840 | 2 | 79,30 | 1,06 | 0,48 | 0,72 | 8,20 | 10,4 | 12,0 | 33,84 | 1,837 | |
| 10 | Castellanos | 4040 | 2 | 77,60 | 0,86 | 0,36 | 0,30 | 8,20 | 10,4 | 12,0 | 30,80 | 1,982 | |
| 11 | Castellanos | 3900 | 2 | 79,20 | 1,24 | 0,12 | 0,46 | 4,60 | 10,5 | 12,1 | 31,68 | 1,846 | |
| 12 | La Capital | 2120 | 2 | 79,30 | 1,82 | 0,66 | 0,28 | 0,00 | 10,8 | 12,5 | 35,47 | 1,744 | |
| 13 | Las Colonias | 3780 | 2 | 80,70 | 1,40 | 0,22 | 0,58 | 0,00 | 10,6 | 12,3 | 40,92 | 1,747 | |
| 14 | Las Colonias | 4310 | 2 | 80,60 | 1,20 | 0,68 | 0,62 | 0,00 | 10,5 | 12,1 | 35,45 | 1,762 | |
| 15 | Las Colonias | 3980 | 2 | 80,50 | 1,10 | 0,22 | 1,14 | 0,00 | 11,3 | 13,1 | 36,14 | 1,834 | |
| 16 | Las Colonias | 4150 | 2 | 80,30 | 0,30 | 0,24 | 0,62 | 3,00 | 10,4 | 12,0 | 32,38 | 1,755 | |
| 17 | San Cristóbal | 3080 | 2 | 81,00 | 0,38 | 0,32 | 0,36 | 4,00 | 10,4 | 12,0 | 32,16 | 2,004 | |
| 18 | San Justo | 3770 | 2 | 80,00 | 0,96 | 0,44 | 0,46 | 2,00 | 11,0 | 12,7 | 35,63 | 1,756 | |
| 19 | San Justo | 2840 | 2 | 80,90 | 1,18 | 0,20 | 0,62 | 0,00 | 10,7 | 12,4 | 33,47 | 1,775 | |
| APPENDIX OF LOCALITY COMPOSITE SAMPLES | |||||||||||||||
| SAMPLE IDENTIFICATION | FLOUR ANALYSIS | ||||||||||||||
| SAMPLE NUMBER | LOCALITY, DISTRICT OR DEPARTMENT | WET GLUTEN(%) | DRY GLUTEN(%) | FALLING NUMBER (sec.) | FLOUR YIELD(%) | FARINOGRAM | ALVEOGRAM | ASH(dry basis)(%) | |||||||
| % WA (14 % H°) | D. T. (min.) | STABILITY (min.) | DEGREE SOFTENING(12 min.) | P | L | W | P/L | ||||||||
| 1 | General Obligado | 23,9 | 8,1 | 377 | 66,74 | 55,0 | 10,3 | 16,2 | 41 | 67 | 118 | 263 | 0,57 | 0,605 | |
| 2 | 9 de Julio | 27,1 | 9,1 | 412 | 58,99 | 57,6 | 9,4 | 18,0 | 38 | 71 | 112 | 263 | 0,63 | 0,675 | |
| 3 | 9 de Julio | 26,2 | 8,7 | 389 | 63,16 | 56,2 | 8,0 | 13,6 | 49 | 60 | 116 | 222 | 0,52 | 0,665 | |
| 4 | 9 de Julio | 27,4 | 9,4 | 421 | 50,92 | 56,5 | 2,2 | 10,4 | 44 | 60 | 128 | 250 | 0,47 | 0,715 | |
| 5 | 9 de Julio | 24,9 | 8,5 | 407 | 47,80 | 56,9 | 1,9 | 2,6 | 50 | 76 | 96 | 253 | 0,79 | 0,675 | |
| 6 | San Javier | 25,5 | 8,5 | 410 | 68,62 | 55,6 | 6,8 | 11,2 | 65 | 61 | 103 | 210 | 0,59 | 0,605 | |
| 7 | Vera | 27,5 | 9,5 | 423 | 68,70 | 57,0 | 2,0 | 9,7 | 45 | 72 | 111 | 266 | 0,65 | 0,685 | |
| 8 | Castellanos | 24,7 | 8,3 | 426 | 70,91 | 56,6 | 1,7 | 6,6 | 58 | 65 | 99 | 207 | 0,66 | 0,605 | |
| 9 | Castellanos | 24,4 | 8,3 | 404 | 68,08 | 57,7 | 1,8 | 7,5 | 57 | 69 | 101 | 220 | 0,68 | 0,605 | |
| 10 | Castellanos | 24,8 | 8,3 | 412 | 69,12 | 54,7 | 2,5 | 12,9 | 40 | 61 | 119 | 228 | 0,51 | 0,565 | |
| 11 | Castellanos | 26,3 | 8,9 | 413 | 71,22 | 55,9 | 8,2 | 16,5 | 41 | 68 | 114 | 244 | 0,60 | 0,575 | |
| 12 | La Capital | 27,2 | 9,1 | 363 | 70,24 | 58,3 | 6,2 | 8,6 | 74 | 60 | 111 | 198 | 0,54 | 0,575 | |
| 13 | Las Colonias | 25,7 | 8,8 | 376 | 69,84 | 60,4 | 2,4 | 10,5 | 46 | 83 | 98 | 251 | 0,85 | 0,615 | |
| 14 | Las Colonias | 25,1 | 8,4 | 418 | 70,04 | 58,8 | 2,0 | 4,1 | 59 | 85 | 83 | 238 | 1,02 | 0,595 | |
| 15 | Las Colonias | 28,4 | 9,6 | 339 | 69,62 | 61,3 | 5,7 | 8,1 | 78 | 77 | 100 | 220 | 0,77 | 0,695 | |
| 16 | Las Colonias | 25,3 | 8,6 | 417 | 69,77 | 57,8 | 2,0 | 2,5 | 47 | 90 | 91 | 282 | 0,99 | 0,495 | |
| 17 | San Cristòbal | 24,7 | 8,2 | 419 | 69,99 | 56,7 | 2,9 | 10,5 | 47 | 89 | 79 | 247 | 1,13 | 0,575 | |
| 18 | San Justo | 27,7 | 9,5 | 367 | 68,21 | 61,2 | 2,4 | 7,8 | 63 | 74 | 101 | 219 | 0,73 | 0,595 | |
| 19 | San Justo | 26,6 | 8,8 | 418 | 68,37 | 57,7 | 2,7 | 8,1 | 63 | 66 | 105 | 207 | 0,63 | 0,635 | |


