SUBREGION NEA

​​​​​​BACKGROUND FOR THE CROP
        

Rainfall was 420 mm along the three months before crop implantation, allowing optimum soil moisture levels. The growing season started end of May and continued until mid-June. Planting was with good soil moisture and extended until mid-July, when short-cycles were implanted.

Growth and tillering were under proper humidity. A strong frost towards the end of July affected the crop; some plants were lost but most could recover. Lack of rains in August became a limiting factor; water reserves were crucial. Grain filling in long-cycle varieties started under water stress. Rains came late in September, favoring short cycle wheat cultivars.

Towards the end of the cycle, day temperatures variations were extreme, between 17 and 43ºC, affecting grain filling and quality.  The little humidity and the high temperatures during the reproductive period prevented diseases.

Harvest started in mid-October, a little late due to rains and drizzles; it continued until mid November. ​​​

Yields varied from 800 kg/h to close to 3,000 kg/h. General average was 1,800 kg/h.

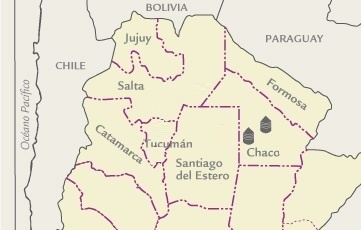
MAP OF THE SUBREGION​​
​ 
 
​RESULTS OF THE ANALYSES

 
WHEAT ANALYSIS​ PARAMETERS MINIMUM MAXIMUM AVERAGE STANDARD DEVIATION VARIATION COEFFICIENT​
Test Weight (kg/hl)​​79,7079,25 78,980,280,35
Shrunken and Broken Kernels​ (%)0,051,44 0,750,7092,67
Foreign Material ​(%)0,230,52 0,380,1538,18
Shrunken and Broken Kernels​ (%)0,070,66 0,370,3076,75​
Yellow Berry Kernels​ (%)0,532,16 1,350,8260,37
Protein (13,5% Moisture)​ (%)10,312,1 11,20,98,04
Protein (dry basis) ​​​(%)11,914,0 13,01,18,09
Weight of 1000 Kernels​ (gr.)30,4330,45 30,440,01​​0,14
Ash (dry basis) ​​​(%)2,0202,137 2,0790,0592,81
Total damaged kernels includes, 0,10% green kernels, 0,09% frosty kernels, 0,38% sprouted kernels, 0,09%i nsect chewed kernels, 0,09% germ-chewed kernels and 0,09% ​calcinated kernels. No damages due to carbon and burned grains.​​​

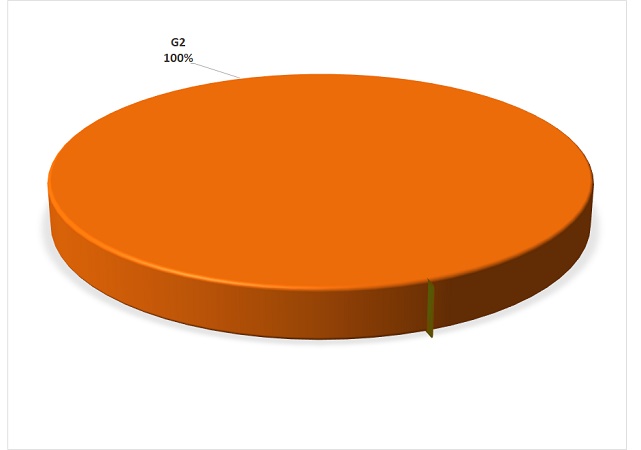
GRADE DISTRIBUTION​​


FLOUR ANALYSIS​ PARAMETERS MINIMUM MAXIMUM AVERAGE STANDARD DEVIATION VARIATION COEFFICIENT​
​MOLIENDAGluten Húmedo (%)SDSD27,3SDSD
Gluten Seco (%)SDSD10,1SDSD​
Falling Number (seg.)SDSD415SDSD​​
Rto. Harina (%)SDSD70,94SDSD
Cenizas (s,s,s,) (%)SDSD0,772SDSD
FARINOGRAMAAbsorción de Agua  (14 % H°) (%)SDSD55,8SDSD
Tiempo de Desarrollo (min.)SDSD6,5SDSD​​
Estabilidad (min.)SDSD16,4SDSD​
Aflojamiento (12 min.)SDSD35SDSD
ALVEOGRAMA
P (mm)SDSD84SDSD​
L (mm)SDSD103SDSD
W Joules x 10-4SDSD294SDSD​
P / LSDSD0,82SDSD
These results were elaborated with 1 composite samples prepared proportionally from 38​ ​primary samples (farmer deliveries).
 

SUBREGION DATA

In this sub region the wheat production was 750.445 tons., the 4,1% of the national total. Were sampled 9.000 tons., the 1,2 ​% of the sub region production.​

 ​ 

APPENDIX OF LOCALITY COMPOSITE SAMPLES​
SAMPLE IDENTIFICATION WHEAT ANALYSIS​
SAMPLE NUMBER LOCALITY, DISTRICT OR DEPARTMENT TONNAJE GRADE TEST WEIGT (Kg/hl) TOTAL DAMAGED KERNELS
(%)
FOREIGN MATERIAL (%) SHRUNKEN AND BROKEN KERNELS (%) YELLOW BERRY KERNELS (%) PROTEIN (MOISTURE 13,5 % H°)
(%)
PROTEIN  (dry basis) WEIGT OF 1000 KERNELS
(gr.)
ASH
(dry basis)(%​)
​​1Chaco - R.S. Peña4500278,701,440,520,662,1612,114,030,432,137
2Chaco - Charata4500279,250,050,230,070,5310,311,930,452,020

APPENDIX OF LOCALITY COMPOSITE SAMPLES
SAMPLE IDENTIFICATION WHEAT ANALYSIS​
SAMPLE NUMBER LOCALITY, DISTRICT OR DEPARTMENT WET GLUTEN(%) DRY GLUTEN(%) FALLING NUMBER (SEG.) FLOUR YIELD(%) FARINOGRAM ALVEOGRAM ASH(dry basis)(%)​
% AA (14 % H°) T, D, (MIN.) STABILITY (MIN.) DEGREE SOFTENING  (12 MIN.)​ P L W P/L
​1 Chaco - R.S. Peña27,310,141570,9455,86,516,435841032940,820,772
2 Chaco - CharataNDNDNDNDNDNDNDNDNDNDNDNDND
ND : No Data​​​​​​