 SUBREGION NEA
BACKGROUND FOR THE CROP
Although farmers started planting wheat in mid-May, sowing was completed only by mid-June, under very good conditions. Short cycles were sown in the first days of July. Some plots were not sown due to lack of humidity from mid-July onwards.
Growth and tillering were under proper soil humidity, thanks to water reserves. In August, atypical cold weather and insufficient sunlight delayed growth and affected the plots that were already flowering. The reproductive stage in long-cycle varieties started under water stress. Rains came late in September, favoring short cycle cultivars.
Harvest started in mid-October, a little late due to rains and drizzles leading to excessive soil moisture; it continued until late November.
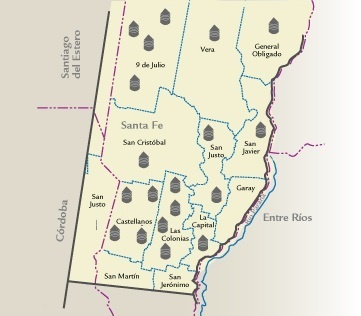
| | MAP OF THE SUBREGION |
 |
RESULTS OF THE ANALYSES
| |||||||||||||||||||||||||||||||||||||||||||||||||||||||||||||||||||||||
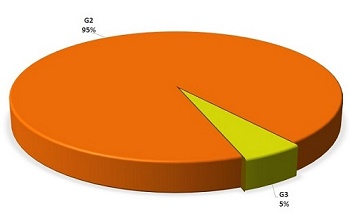
| | GRADE DISTRIBUTION |

|
| FLOUR ANALYSIS |
PARAMETERS | MINIMUM | MAXIMUM | AVERAGE | STANDARD DEVIATION | VARIATION COEFFICIENT | |||
| MILLING | Wet Gluten (%) | SD | SD | 26,4 | SD | SD | |||
| Dry Gluten (%) | SD | SD | 9,8 | SD | SD | ||||
| Falling Number (s) | SD | SD | 259 | SD | SD | ||||
| Flour Yield (%) | SD | SD | 69,60 | SD | SD | ||||
| Ash (dry basis) (%) | SD | SD | 0,717 | SD | SD | ||||
| FARINOGRAM | Water Absorption (14%H°)(%) | SD | SD | 57,8 | SD | SD | |||
| Development Time (min.) | SD | SD | 3,9 | SD | SD | ||||
| Stability (min.) | SD | SD | 9,3 | SD | SD | ||||
| Degree of Softening(12 min.) | SD | SD | 63 | SD | SD | ||||
| ALVEOGRAM | |||||||||
| P (mm) | SD | SD | 95 | SD | SD | ||||
| L (mm) | SD | SD | 72 | SD | SD | ||||
| W Joules x 10-4 | SD | SD | 261 | SD | SD | ||||
| P / L | SD | SD | 1,32 | SD | SD | ||||
| These results were elaborated with 2 composite samples prepared proportionally from 33 primary samples (farmer deliveries) | |||||||||
SUBREGION DATA
In this sub region the wheat production was 636.660 tons., the 3,3 % of the national total. Were sampled 8.000 tons., the 1,3% of the sub region production.
| APPENDIX OF LOCALITY COMPOSITE SAMPLES | |||||||||||||
| SAMPLE IDENTIFICATION | WHEAT ANALYSIS | ||||||||||||
| SAMPLE NUMBER | LOCALITY, DISTRICT OR DEPARTMENT | TONNAJE | GRADE | TEST WEIGT (Kg/hl) |
TOTAL DAMAGED KERNELS (%) | FOREIGN MATERIAL (%) |
SHRUNKEN AND BROKEN KERNELS (%) | YELLOW BERRY KERNELS (%) |
PROTEIN (MOISTURE 13,5 % H°) (%) |
PROTEIN (dry basis) (%) |
WEIGT OF 1000 KERNELS (g) |
ASH (dry basis) (%) | |
| 1 | Chaco - Charata | 4000 | 2 | 79,70 | 0,53 | 0,22 | 0,40 | 0,68 | 11,9 | 13,8 | 30,67 | 2,071 | |
| 2 | Chaco - R.S. Peña | 4000 | F/E (3) | 78,60 | 4,19 | 0,07 | 0,41 | 1,04 | 11,9 | 13,8 | 31,52 | 2,069 | |
| APPENDIX OF LOCALITY COMPOSITE SAMPLES | |||||||||||||||
| SAMPLE IDENTIFICATION | FLOUR ANALYSIS | ||||||||||||||
| SAMPLE NUMBER | LOCALITY, DISTRICT OR DEPARTMENT | WET GLUTEN(%) | DRY GLUTEN(%) | FALLING NUMBER (sec.) | FLOUR YIELD(%) | FARINOGRAM | ALVEOGRAM | ASH(dry basis)(%) | |||||||
| % WA (14 % H°) | D. T. (min.) | STABILITY (min.) | DEGREE SOFTENING(12 min.) | P | L | W | P/L | ||||||||
| 1 | Chaco - Charata | 26,8 | 9,9 | 274 | 70,00 | 56,0 | 4,0 | 12,2 | 48 | 83 | 79 | 250 | 1,05 | 0,711 | |
| 2 | Chaco - R.S. Peña | 26,0 | 9,6 | 244 | 69,20 | 59,5 | 3,8 | 6,4 | 78 | 107 | 65 | 272 | 1,65 | 0,722 | |


