Superficie sembrada y cosechada, rindes y producción por subregiones
| SubRegion | SupSembrada | SupCosechada | Rinde | Produccion |
|---|---|---|---|---|
| Sub I | 818.932 | 759.532 | 2593,00 | 1.969.580 |
| Sub II N | 877.140 | 871.940 | 3458,00 | 3.015.201 |
| Sub II S | 1.192.837 | 1.187.726 | 3779,00 | 4.487.947 |
| Sub III | 712.200 | 691.600 | 3207,00 | 2.217.630 |
| Sub IV | 538.366 | 538.366 | 4099,00 | 2.206.614 |
| Sub V N | 602.099 | 556.008 | 2187,00 | 1.215.924 |
| Sub V S | 983.082 | 972.774 | 2398,00 | 2.332.924 |
| NEA | 317.050 | 289.248 | 1116,00 | 322.682 |
| NOA | 369.305 | 350.645 | 1153,00 | 404.233 |
| Nacional | 6.411.011 | 6.217.839 | 2,92 | 18.172.735 |

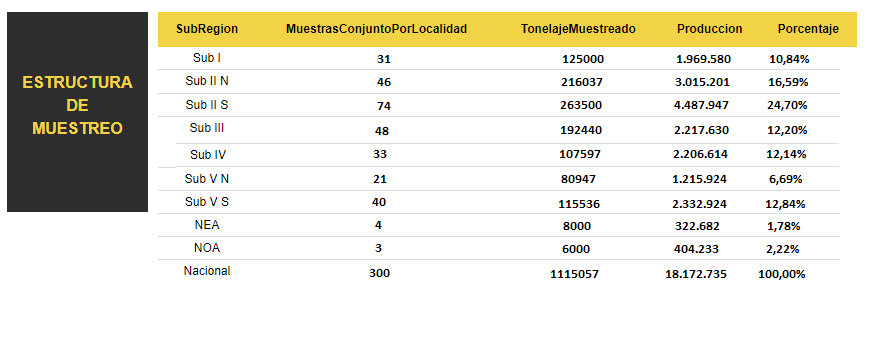
Porcentaje de la producción representada en el relevamiento


